
Key Market Insights and Stocks Covered This Week
- A broad-based rebound remains our base case. The correction is well advanced, valuations have improved and US growth and earnings remain strong.
- The midterms and the Middle East are key potential clearing events. Escalation is a real risk, but a diplomatic breakthrough could wrong-foot a bearish market.
- Commodities and Japan’s banks remain in focus with reporting season approaching and after a decent pullback in the TOPIX bank index.
- Rising Chinese consumer gold demand underpins our conviction that gold will soon get back to $5,000oz
- We covered off on the uranium market this week, where the construction of nuclear power plants has hit a 40yr high. This underpins our bullish view on uranium miners and higher Japanese rates support our conviction.
- The RBA faces an increasingly difficult choice. Stubborn inflation raises the prospect of another hike as pressure on the economy builds. Australia will likely get another rate hike next week, but could that be the straw that breaks the camels back in terms of the economy?
Free this week: our October research note on Paladin Energy (ASX:PDN) and a spotlight on Microsoft (US:MSFT).
The fatLITE is a weekly read. Membership is the position.
Fat Prophets Platinum, our full service, for $695 a year until midnight Monday, 2nd November. Join at $695.
With the rolling correction in financial markets enduring for two months now, a lot of fear is now already in the price. We have conviction that a significant, broad-based rebound is coming. The correction has done more damage than the headline indices suggest, yet US consumers are still spending up in spades and corporate earnings are delivering. The market is questioning whether a rally can be sustained into year-end. We remain firmly of the view that it can. The midterms and the next move in the Middle East could prove decisive. Escalation is a real risk, but a breakthrough would catch a bearish market off guard. Upside risks prevail in our view—and the opportunities are becoming harder to ignore.
The “clocks are ticking down” to the midterm elections, and markets will soon know whether the US goes ahead with further military strikes, with a third aircraft carrier group in the Gulf. However, a lot of risk has been baked into the stock market, and there is also a significant risk premium priced into oil. Any sign of both parties heading back to the negotiating table — or reaching an MOU — presents a significant upside risk for the markets in my view. Meanwhile, one ticking clock in terms of the Fed’s FOMC meeting is now out of the way and behind the markets.
The Verdict
US growth valuation and market breadth
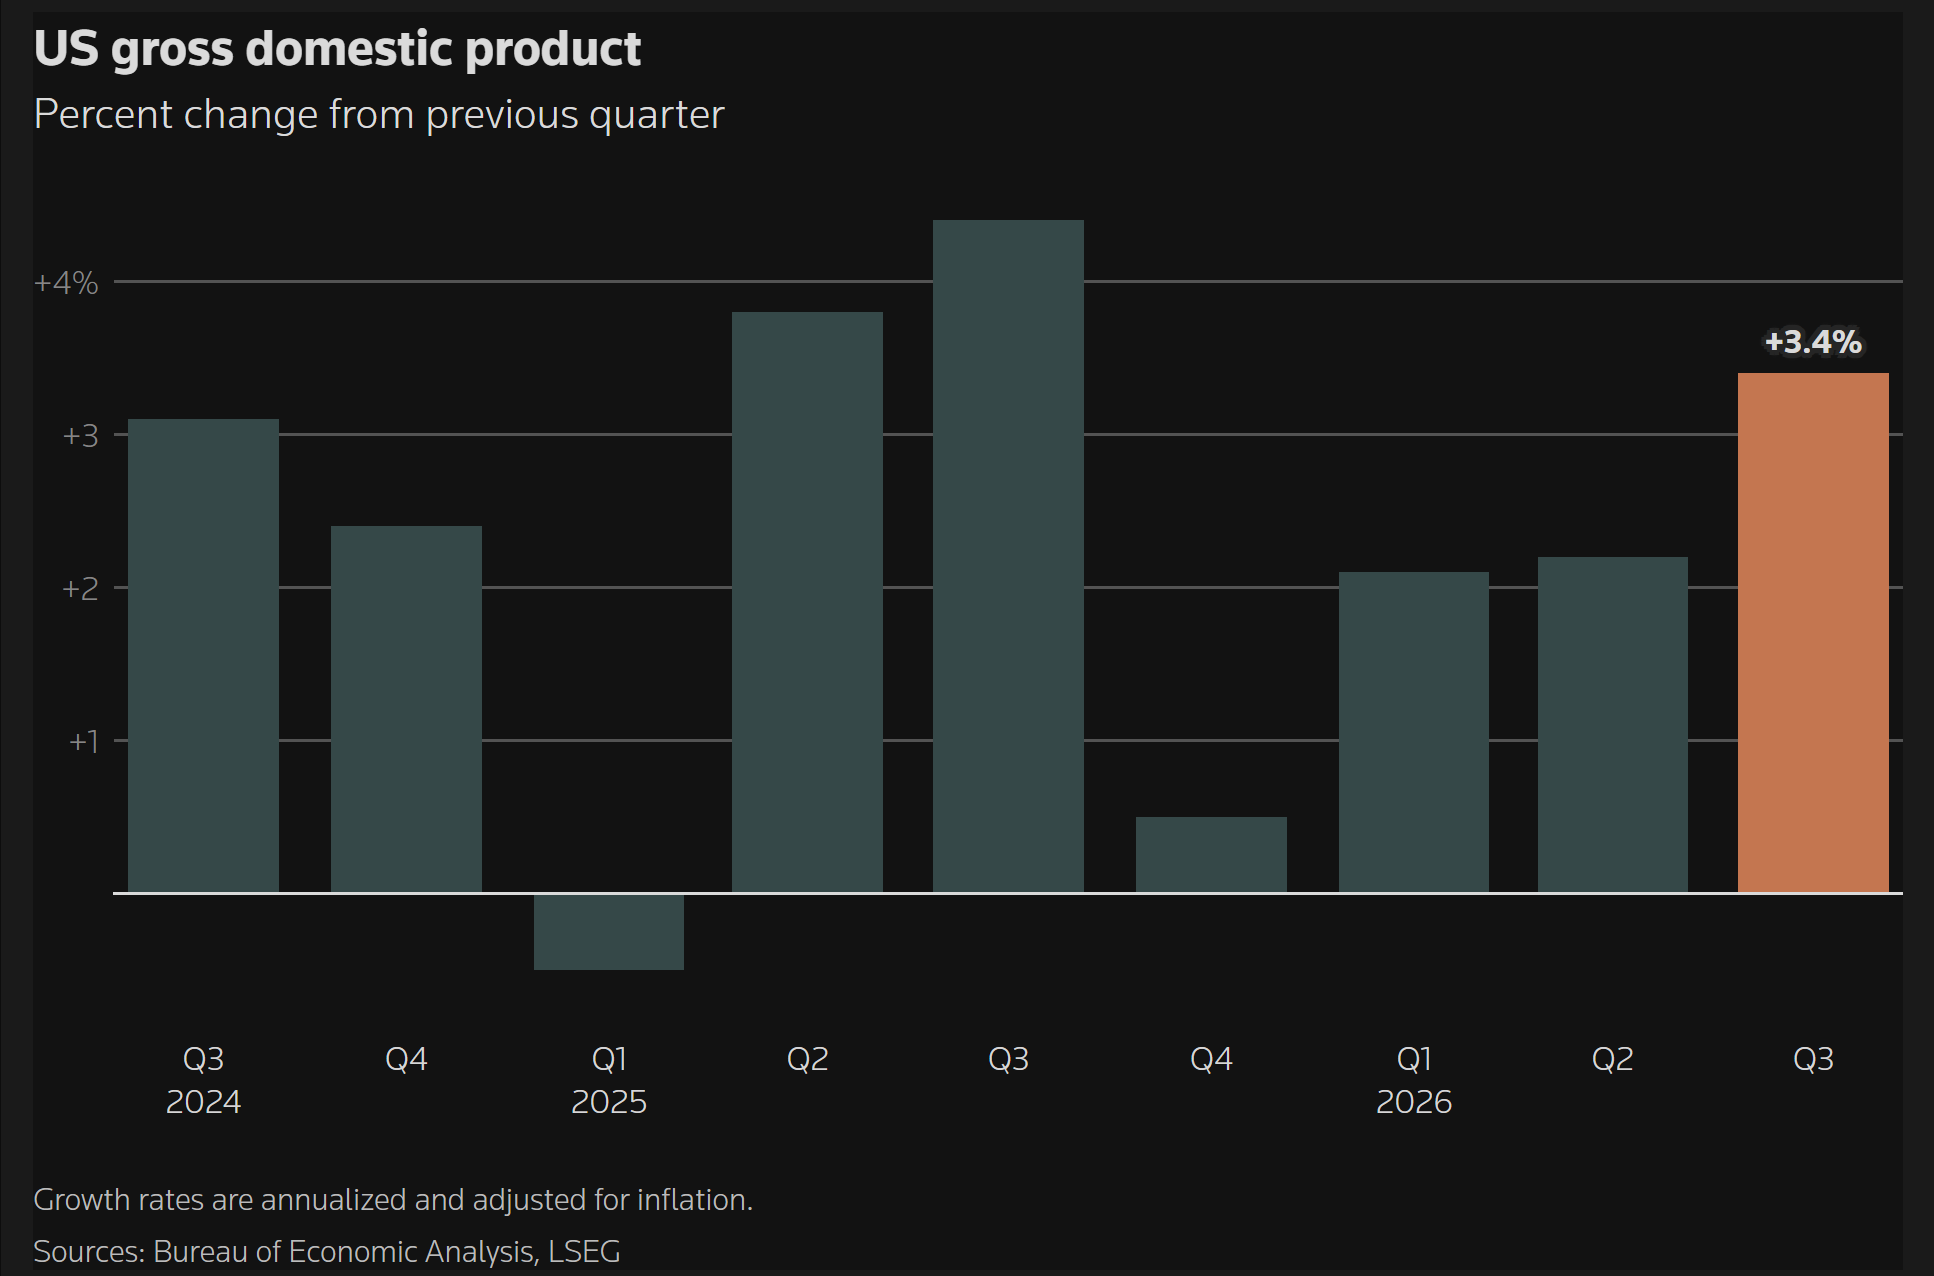
A raft of economic data released on Thursday pointed to the US remaining very strong, as third-quarter GDP showed the economy grew at a faster-than-expected pace, despite higher inflation. The resilient growth will underpin the market and, importantly, earnings well into the first half of 2027. Meanwhile, the S&P 500’s valuation has fallen, leaving stocks at their cheapest since the tariff storm last year, with the forward PE multiple now well below 19 times.
S&P 500 forward price-to-earnings ratio
The rebound in the Russell 2000 and rotation into small/mid-cap stocks this week have also been encouraging. At the onset of a typical bear market, small/mid-cap stocks are typically the first to roll over, given their greater sensitivity to the economy. But in a bear market, the Russell 2000 would stay down and not rebound. The performance of the Russell 2000 this week was telling, and the breakout points to upside momentum resuming following a 10% corrective drawdown in September and October.
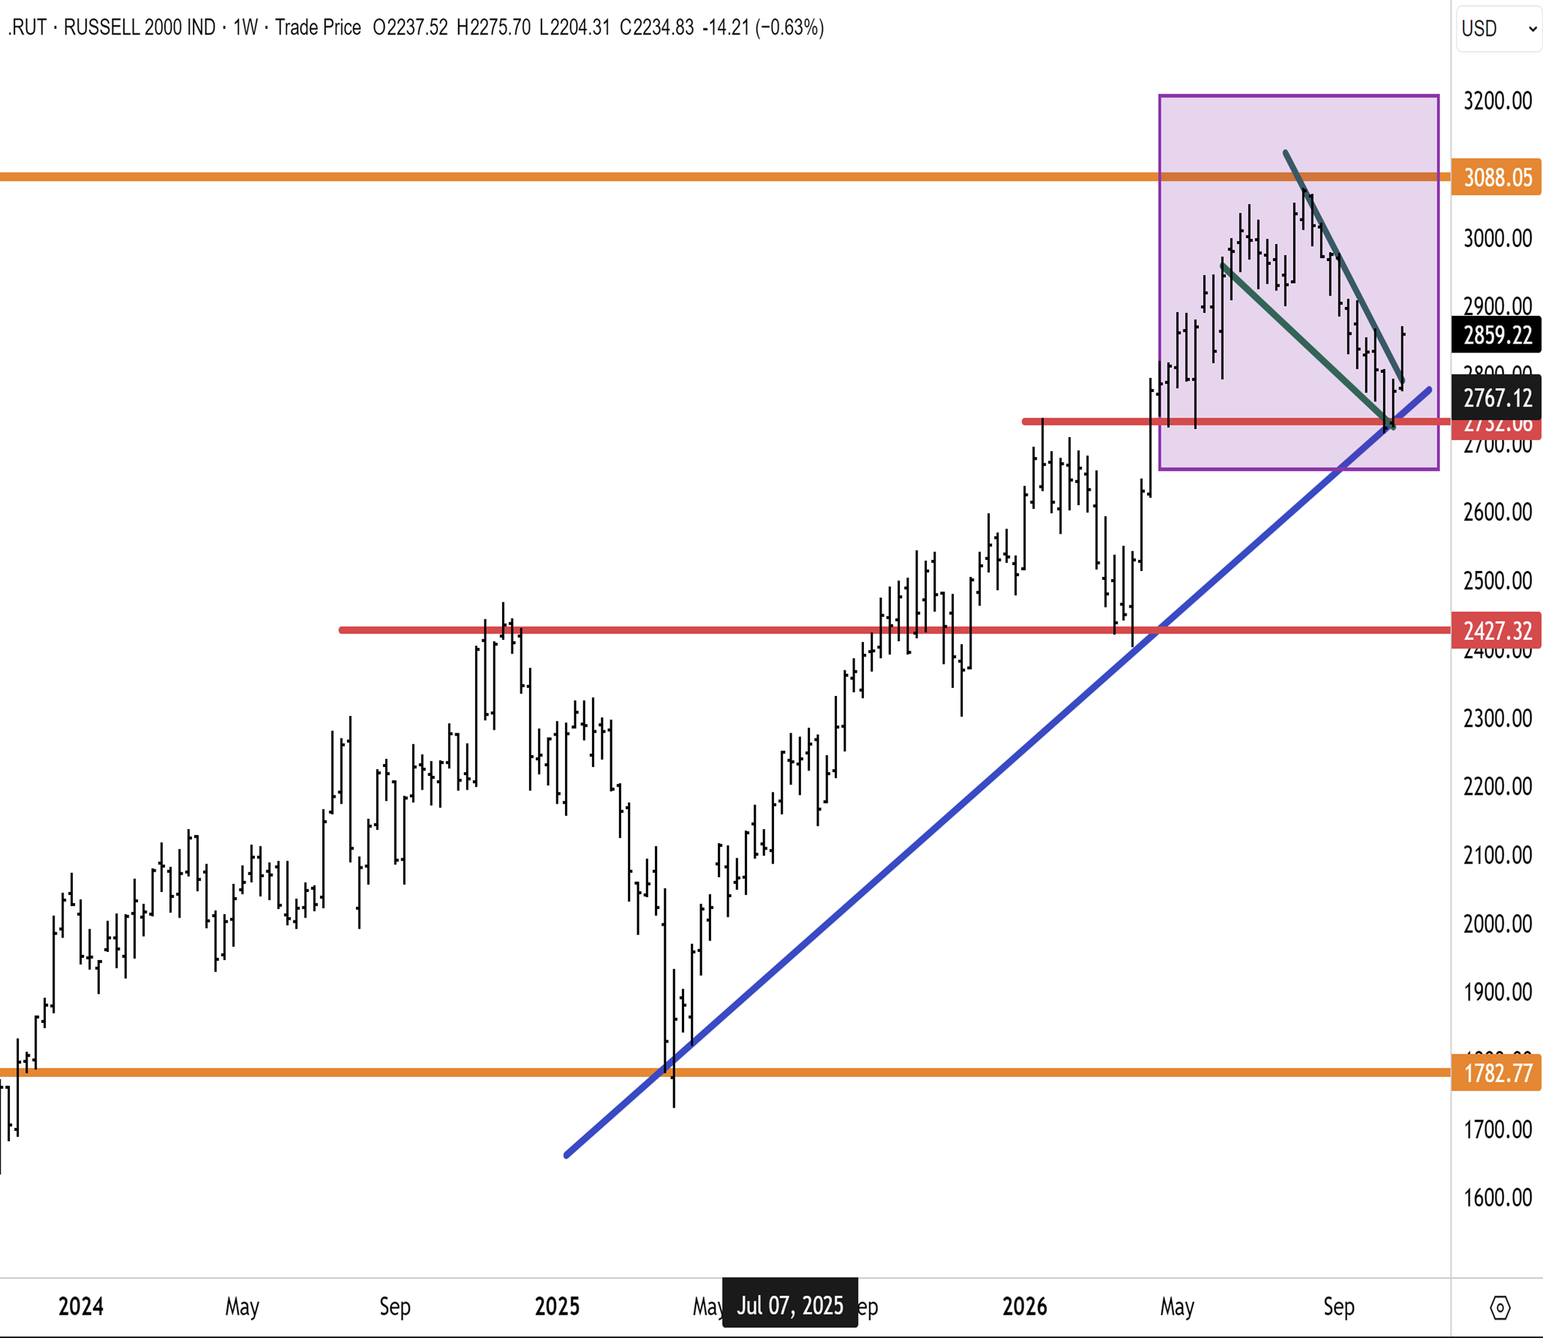

Russell 2000 — technical chart
Our base case remains a strong finish to the year
The correction in equities and risk assets that has played out since September has been more severe than major benchmarks such as the S&P 500 would suggest. A rolling correction over the past eight weeks has seen many stocks in the US and international markets decline by well over 10–20%, while sectors such as semiconductors and chip stocks have been affected to a greater degree. There has been significant rotation beneath the surface and significant dispersion.
Central to our case that financial markets, led by the US, will finish strongly this year is the view that the economy remains strong, consumers are still spending, and importantly, corporate earnings are going to continue growing strongly.
US gross domestic product increased at a 3.4% annualised rate last quarter, the quickest since the third quarter of 2025. Consumer spending, which accounts for more than two-thirds of the economy, increased at a 3.8% rate in the July-September period, matching the second quarter’s pace. That spending was largely driven by services, including healthcare, visits to restaurants and bars, as well as hotel and motel stays. So, despite the poor sentiment readings, US consumers are still spending up in spades.
The September US earnings season is delivering, with most companies reporting results that exceed expectations. Whilst we have likely seen the peak in earnings growth and upward analyst revisions, valuations have substantially improved, with forward P/E multiples for the S&P 500 now below 19 times, at around 18.4–18.7 times. This contrasts with a forward P/E multiple of 23 times in September last year.
US GDP — annualised quarterly growth. Source: Bureau of Economic Analysis, LSEG.
However, on the inflation front, prices are rising and this will likely prompt the Fed to raise rates in December. The key Personal Consumption Expenditures price index increased 0.5% in September after rising 0.3% in August. At some point, this inflation is going to bite, with fuel costs causing much of the impetus for higher prices. However, the narrative could change soon should oil prices recede.
Consequently, we remain of the view that the correction is now well advanced and see a conclusion arriving soon. October stands out and often proves to be the nadir for corrective sell-offs. With the FOMC meeting now behind the market, the US midterms and an agreement around the Middle East could prove to be clearing events. Upside risks therefore prevail in our view. Our base case is that the bull cycle will soon continue and that financial markets, risk assets and equities will finish the year very strongly.
The Calls
Oil could be the circuit breaker
Oil prices have fallen modestly this week as traders assess fresh diplomatic efforts in the ME to avert a potential restart of US military strikes on Iran. According to reports on Bloomberg, Iran’s Foreign Minister said the government continued to give diplomacy a chance and was open to further negotiations. Meanwhile, President Trump said this week that negotiations were taking place through mediators but stressed he “didn’t know whether they would bear fruit”. Will a rabbit be pulled out of the hat at the 11th hour?
WTI crude fell on Tuesday despite a missile strike by the Houthis on Saudi energy infrastructure. Overhead resistance has emerged this week with WTI falling sharply from $110 to below $100, which might define a downside reversal. For WTI to move decisively lower and below $90, we need to see the ME stabilise.
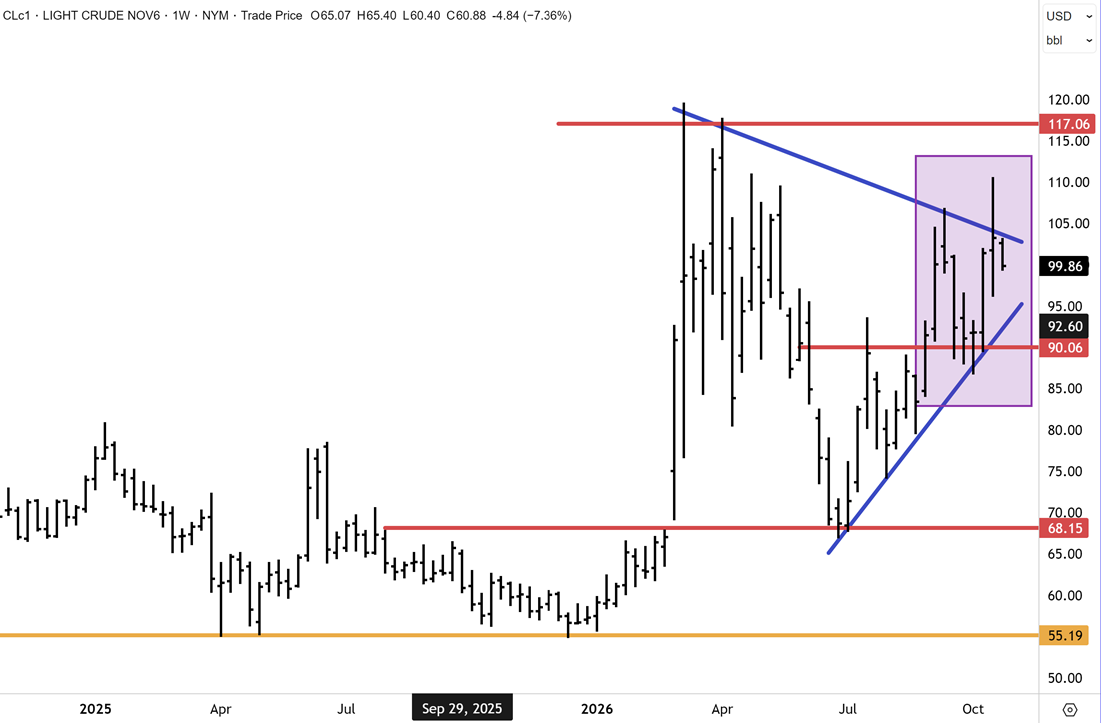
WTI crude — resistance near US$110; a decisive move below US$90 depends on Middle East stabilisation.
We concede that escalation in the ME is a real near-term risk for the markets, but this is well recognised by financial markets and significantly priced in now. In my view, this could also prove to be another clearing event for the markets – one way or another. The JPM trading desk concluded that the arrival of the carrier group remains a key risk, “but if Trump moves back to negotiations rather than kinetics, then we expect a broad-based rally led by Technology, and Cyclicals ex-Energy.”
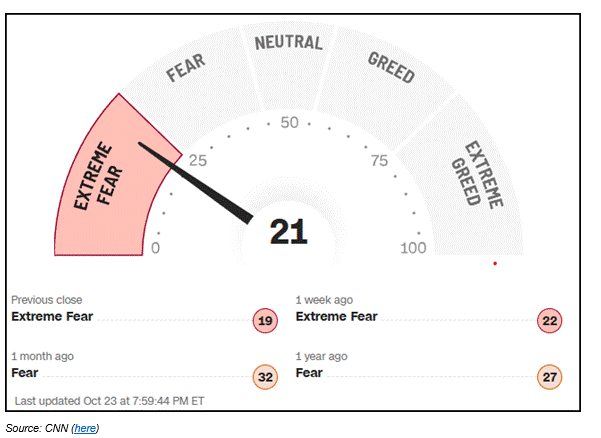
The bottom line is that in terms of sentiment, “the pendulum has swung” towards bearishness and outright pessimism. Financial markets have already discounted and priced in a lot of fear and bad news. This confluence of factors often defines a turning point in the markets.
Uranium stocks are presenting opportunity
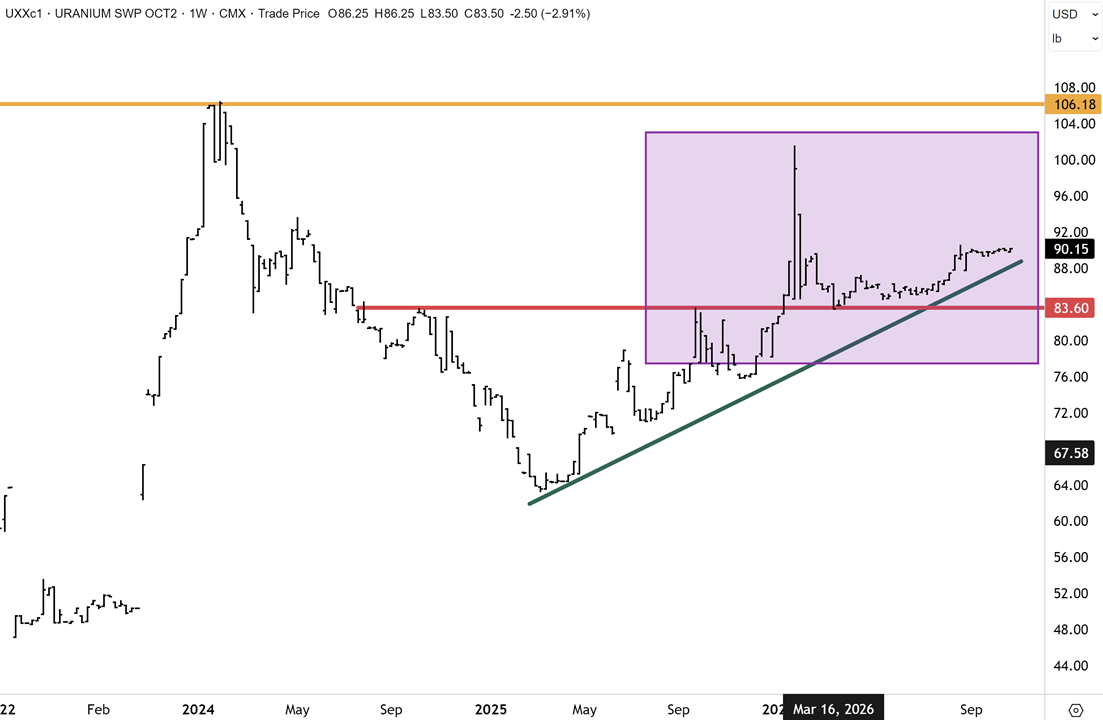
We remain bullish on uranium prices and the miners. Even though the day-to-day “spot” price of uranium has been moving sideways in 2026, the underlying market fundamentals remain strong. Long-term contract prices have continued to rise, hitting about US$96 per pound by the end of September.
The IEA estimates that around 90 GW of nuclear power capacity is currently under construction globally — the highest level in four decades. We remain constructive on uranium, and following the recent pullback in Australian and global miners, opportunity is re-emerging within the sector. J.P. Morgan forecasts a brief supply shortage in 2027–28, followed by a surplus in 2030–35; we remain bullish despite those longer-term supply assumptions.
Uranium prices are now tracking higher and have recovered from lows in the $60s last year to $90 in recent weeks. Technically, uranium prices look set to retest the 2024 highs above $106 a pound.
The Local
Australia’s inflation dilemma
In Australia, this week’s CPI print was not good news, and inflation is tracking higher than consensus estimates and headed in the wrong direction. Consequently, the RBA faces renewed pressure to raise interest rates after September quarter-on-quarter inflation data came in above expectations. Underlying inflation, which strips out unusually large price movements, rose to 3.7% from 3.6% in June, rather than holding steady as markets expected. It was also above the RBA’s forecast of 3.4%. This reverses the more reassuring picture from June, when inflation had been trending lower and came in below forecasts.
Higher petrol prices were a major contributor, with a 9.4% increase pushing headline inflation to 4.3%, up from 4% in August. But price pressures were not limited to fuel. Annual services inflation reached 4.1%, while rents, new-home construction, restaurant meals and car repairs also became more expensive. RBA Governor Michele Bullock warned that higher oil and transport costs could spread through the economy as businesses pass them on to customers. As it relates to the rise in rents, the budget didn’t help and I hold a strong view that the abolition of negative gearing will reduce the available rental housing stock.
Financial markets responded by increasing the estimated chance of a Melbourne Cup day rate rise from 69% to 87%. Such a move would take the cash rate to 4.85%. Markets were also fully pricing in an increase by Christmas. Although economic growth is slowing, the stronger inflation figures and a still tight jobs market (unemployment is heading higher) make it harder for the RBA to leave rates unchanged.
Treasurer Jim Chalmers promised savings in the mid-year budget update but did not say whether they would outweigh new spending. The opposition blamed government spending for keeping inflation high, while Treasury Secretary Jenny Wilkinson argued that private demand and the Middle East conflict were the main causes. She also correctly observed that higher interest rates were beginning to weaken the jobs market, but missed the mark on residential housing where there has been outright price destruction since the Budget.
There is no question that the series of rate hikes implemented by the RBA is now a major headwind for the Australian economy. Another rate hike next week could be the straw that breaks the camel’s back, and I am almost certain now that the unemployment rate will be heading towards 5% by year-end.
The central concern for the RBA is that inflation remains stubbornly high even outside areas directly affected by the energy shock. Prolonged inflation could lead households and businesses to expect prices to keep rising too quickly. But then on the other hand, the RBA is in a dilemma and risks overtightening and pushing the economy towards an official recession.
Fuel costs are one of the main drivers, but this impact could reverse quickly if a deal is reached in the ME (our base case). The unresolved problem is that government spending is too high. No spending cuts have been put on the table, and on this front the RBA is increasingly being backed into a corner. A rate hike is probable now, but this is dialling up the risk of the nation falling into recession.
Report Spotlight
Microsoft (US:MSFT) – BUY
Microsoft released very solid results this week, with the stock performing strongly. The company highlighted very strong demand for cloud computing and AI tools to support further growth in sales and profits. Looking ahead, the key question for the market is whether Microsoft can keep turning demand for Azure and Copilot into higher earnings while controlling the cost of its enormous investment program.
Microsoft is offering voluntary buyouts (or redundancies) to around 60,000 employees, roughly a quarter of its workforce, as it cuts costs and shifts resources towards artificial intelligence.
The offer covers eligible staff at vice-president level and below in the US, Canada, India and the UK. This is not an announcement of 60,000 job cuts: employees have to accept the offer.
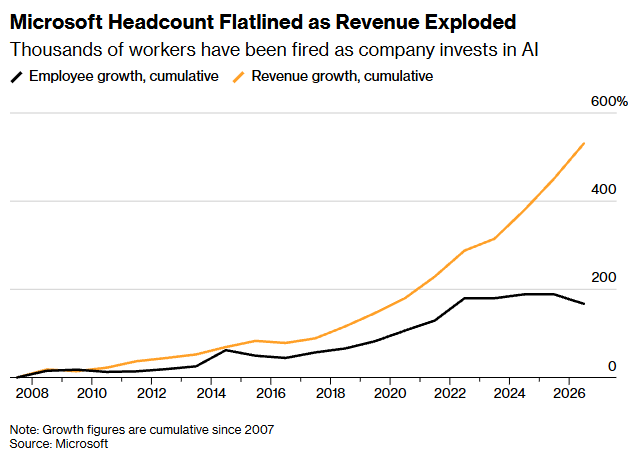
Azure remains the main growth engine. Azure might potentially grow faster than Microsoft’s guidance of 49–50%. The company is getting more out of its existing infrastructure while adding new capacity.
Copilot provides another growth opportunity. Microsoft added another 10 million Copilot seats last quarter.
MSFT is priced on a forward PE multiple of around 25 times earnings, but this valuation still leaves plenty of room for upside. Most broker price targets lie well north of $600, and while the stock has performed strongly this year, there is plenty of room for further upside given strong cloud growth, rising Copilot adoption and rising profits and substantial positive free cash flow.
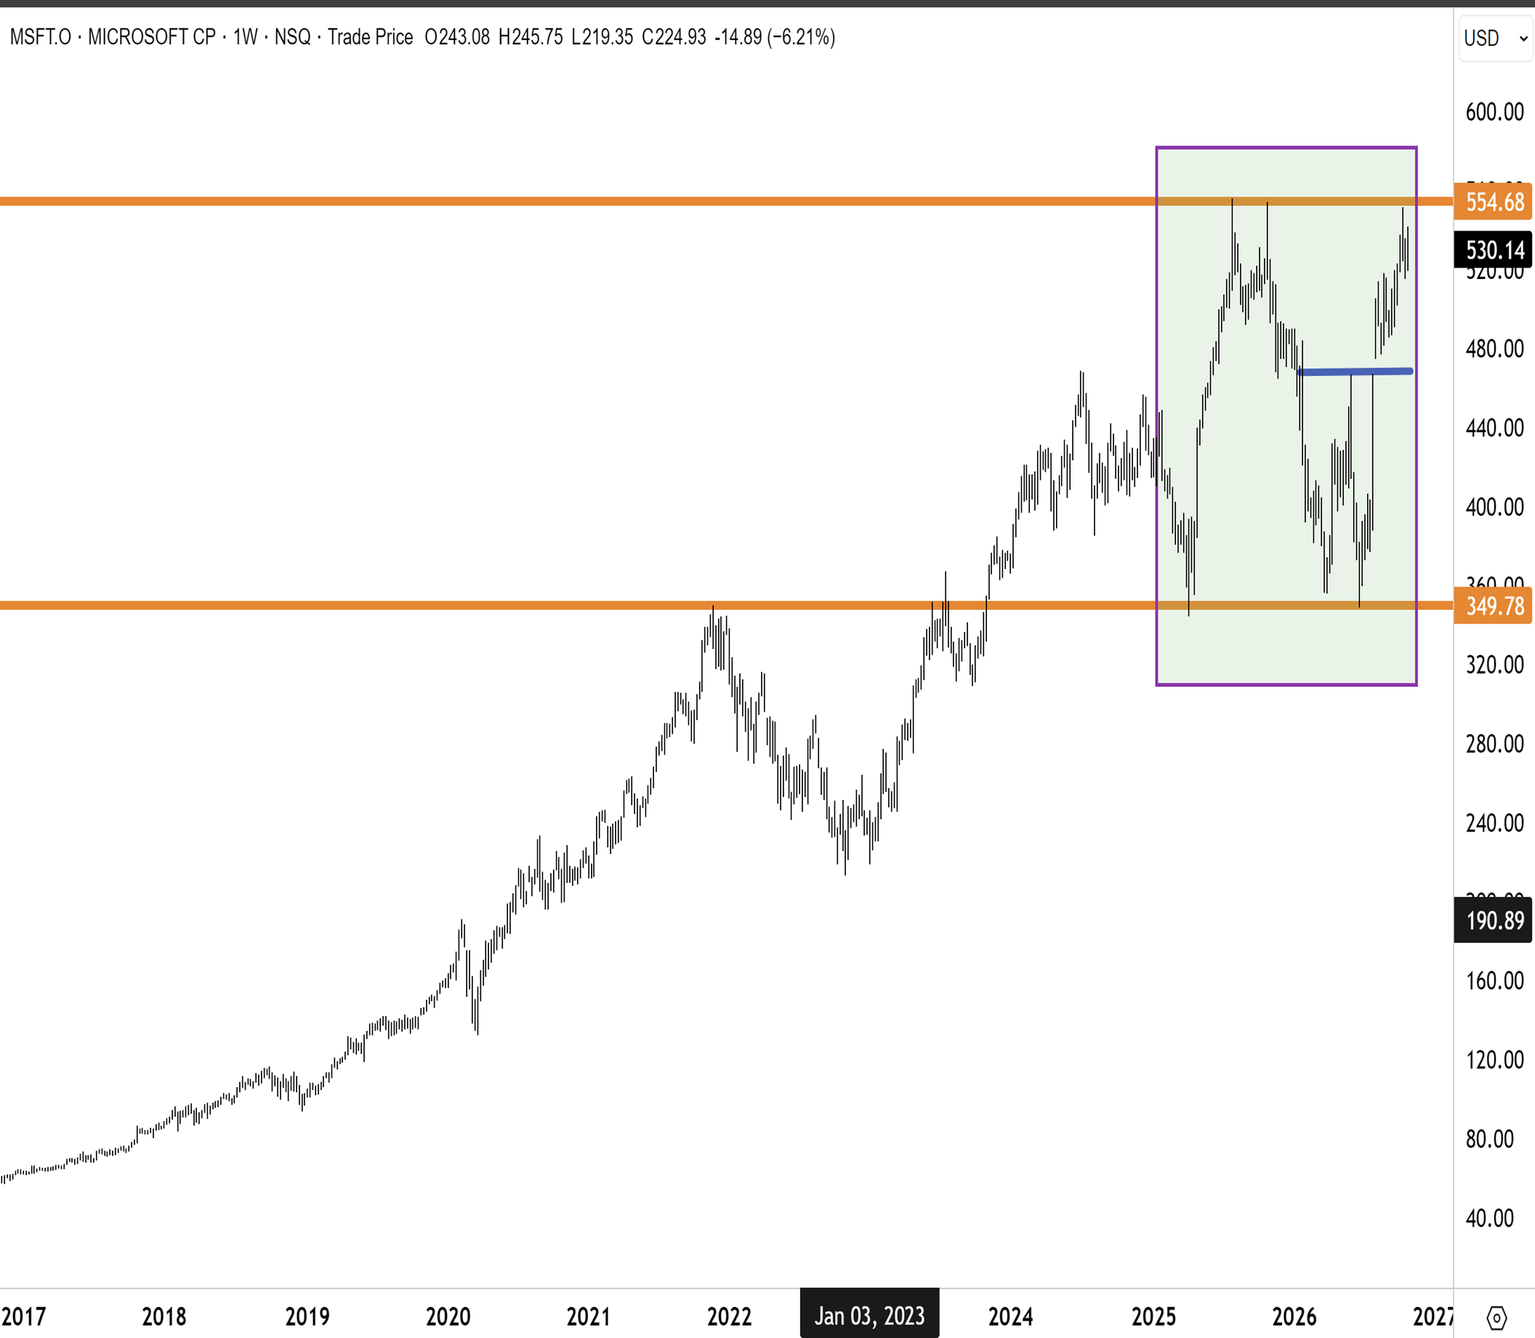
Microsoft — original technical chart; prices in US dollars.
After breaking out above resistance at $400, MSFT has pushed towards the top end of the trading range near the record highs at $554. This followed a multi-month correction during which MSFT traced out an important bottom above support at $350. We hold conviction that Microsoft will retest and break out above the old record highs at $554 later this year.
See what our members get. For a uranium idea on the ASX, here is a recent research report on Paladin Energy (ASX: PDN), free for fatLITE readers.
- Uranium contracts remain firm despite weaker share prices. Long-term prices near US$97 a pound support Paladin’s revenue outlook, although contract terms affect when higher prices flow through.
- Langer Heinrich holds the key to better returns. Higher production and lower costs could improve cash generation, while a prolonged operating shortfall remains the main risk.
- We maintain our BUY rating. Support is emerging near A$7, with resistance around A$8. We see an accumulation opportunity for investors taking a medium- to longer-term view.
Download the Paladin report (PDF).
Members get research like this as it is published. As a fatLITE reader, you can join Fat Prophets Platinum, our full service covering Australian and international stocks, mining and resources, and the daily fatCHAT, for $695 a year until midnight Monday 28 September. Join at $695.
Banking on Japan
Following the rolling correction in financial markets, Japan’s banks might present a good opportunity and a sector in which to add some risk. Japan’s banks have been strong performers for several years and likely still have further significant re-rating potential in our view.
Japanese banks look set to deliver solid first-half results, with higher domestic interest rates continuing to support lending income. Recent share price weakness in the sector has brought concerns over AI-related lending into focus, but we do not currently expect potential losses to threaten the banks’ capital positions. The broader earnings outlook remains constructive, supported by further expected rate hikes by the BOJ, resilient corporate borrowing demand and continued dividends and share buybacks. Our preferred exposures amongst the mega-cap banks are Sumitomo Mitsui Financial Group, Mizuho Financial Group and Mitsubishi UFJ.
The TOPIX Bank Index has corrected sharply from multidecade highs. The index has fallen 16% since September and is now finding support at the uptrend in place since 2024. We anticipate upside momentum to reassert itself soon, which is consistent with our call for financial markets to rally broadly into year-end/May 2027.
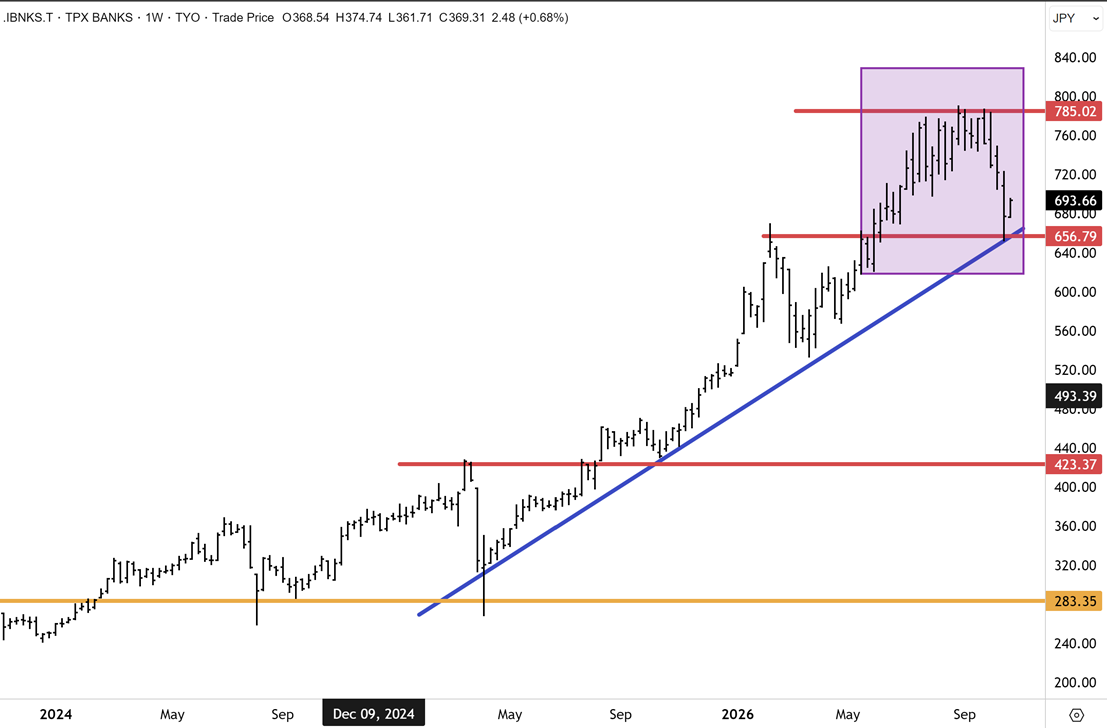
TOPIX Bank Index — testing the uptrend after a 16% correction from September.
SMFG (JP: 8316) , which we rate a BUY, is the largest holding in the Fat Prophets Global Contrarian Fund. We see solid earnings and shareholder returns that might exceed market expectations. We anticipate upward momentum to resume soon and see ¥4,000 as being a plausible technical price target.
We also highly rate Mizuho (JP: 8411). Mizuho’s latest quarterly profit rose 45.5% from a year earlier. Management estimates each 25 bp rise in the BOJ cash rate adds ¥120 billion a year before tax, though higher deposit costs could be a headwind. Support is being found at the two-year uptrend line above ¥7,200. The sharp correction opens a technical buying opportunity.
Thank you for reading fatLITE. We value you as a reader, so here is an offer for you: Fat Prophets Platinum, our full service covering Australian and international stocks, mining and resources, and the daily fatCHAT, for $695 a year until midnight Monday 28 September. Join at $695.
Have a great weekend.
Carpe Diem
Angus Geddes
Founder, Fat Prophets
